Getty Images
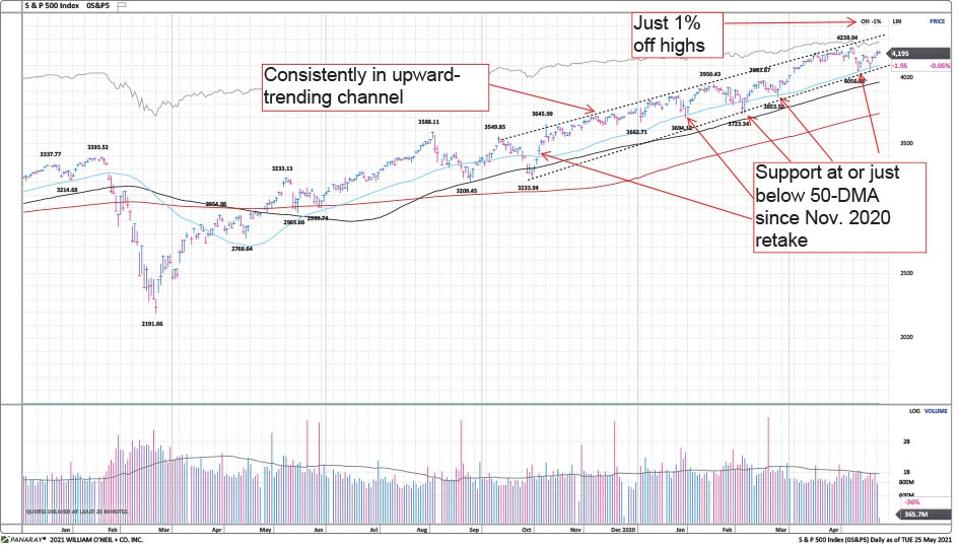
Despite some bumps along the way, the bull market that began at the end of March 2020 remains intact. After a period of consolidation around the 2020 presidential election, U.S. equities have ground relentlessly higher, as shown on the chart below. At the moment, the market is toying with new highs.
The S&P 500 has been steadily trending higher since November 2020. There has been a bit of consolidation recently, but there is support at the 50-DMA and the index is back within 1% of highs.
William O'Neil + Co.
One of the factors enabling the extension of this bull market is the shift in leadership this year. Whereas 2020 was driven by stocks that benefited from pandemic-related lockdowns, recent gains have been driven by businesses that should benefit dramatically as the U.S. economy re-opens and the pandemic fades domestically.
This has resulted in a rotation out of Technology and speculative areas like SPACs, IPOs, and Biotech and into Financials, Industrials, and Materials. Earnings growth differentials between growth stocks and value stocks are narrowing as the economy gains momentum, so the former areas’ significant valuation premiums might no longer be warranted. Materials has been boosted by strong moves in commodities such as oil, aluminum, copper, and corn, all of which are up more than 20% year-to-date.
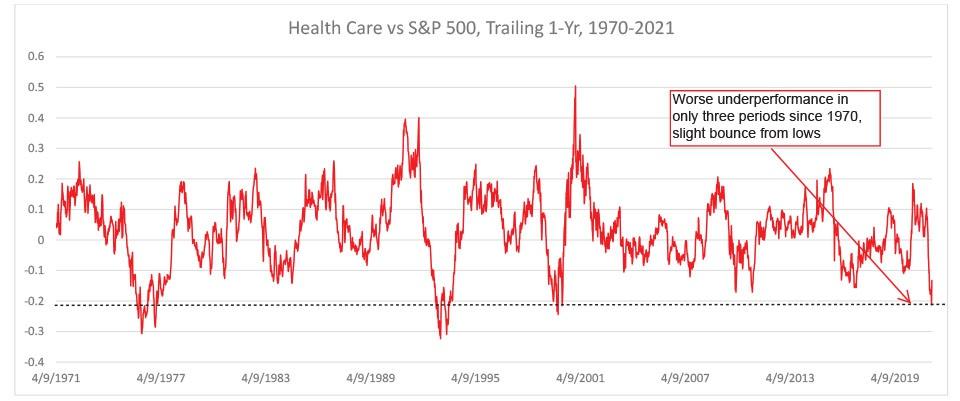
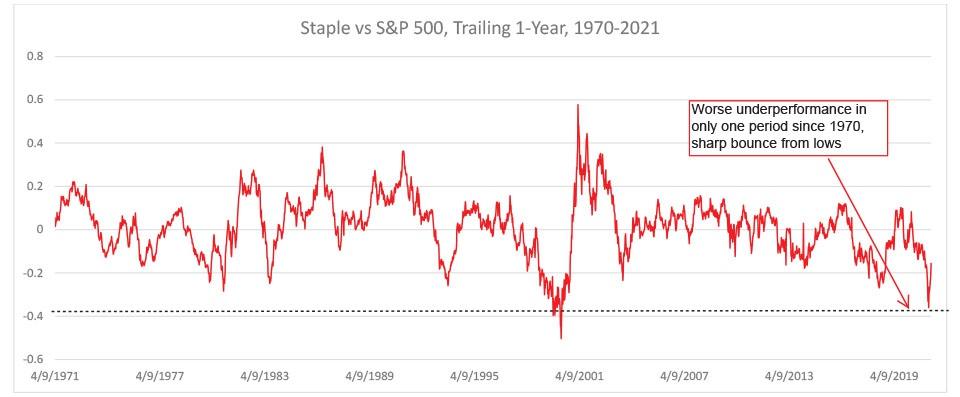
Interestingly, defensive growth groups Health Care
William O'Neil + Co.
William O'Neil + Co.
The shifting of leadership groups is usually a healthy sign for a bull market, and I continue to favor equities relative to other asset classes. However, if the weakness in former growth leaders were to spread to other areas, I would become more cautious. Investors should stay disciplined and not chase extended individual stocks or groups nor buy the aforementioned areas of high-valuation growth that are now bouncing from oversold levels back into potential spots of resistance.
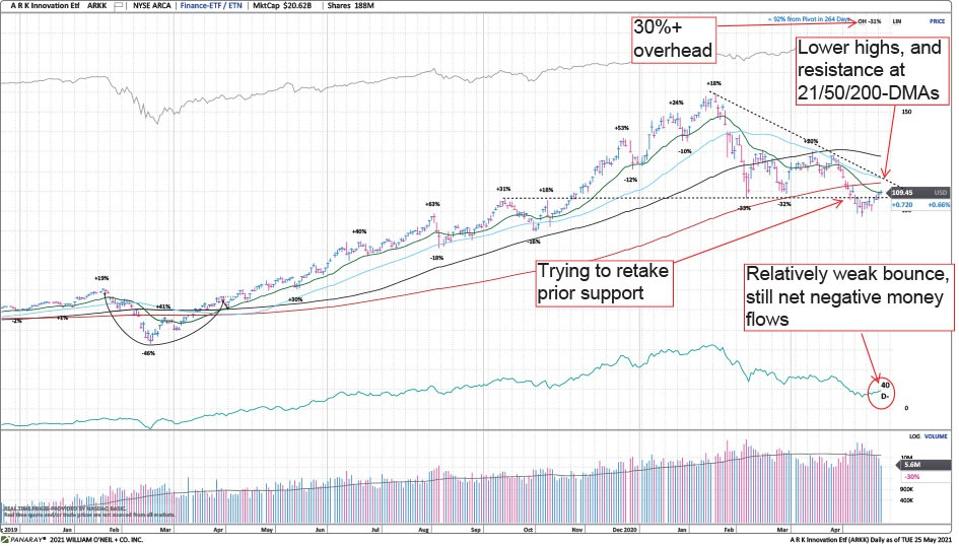
To get a sense of how many of those former leaders are acting, let’s look at the Ark Innovation ETF. Its holdings span the software, clean energy, biotech, new media, internet content, and payment categories. While there is no doubt these are some of the best long-term areas of growth, many stocks as well as the ETF itself have significant overhead after a steep drop from February. While there are some bounces from lows at the moment, there could be a difficult period ahead given several likely areas of moving average and price resistance. We would, in general, avoid setups like these and wait for better technical entries once some of the overhead is cleared out.
William O'Neil + Co.
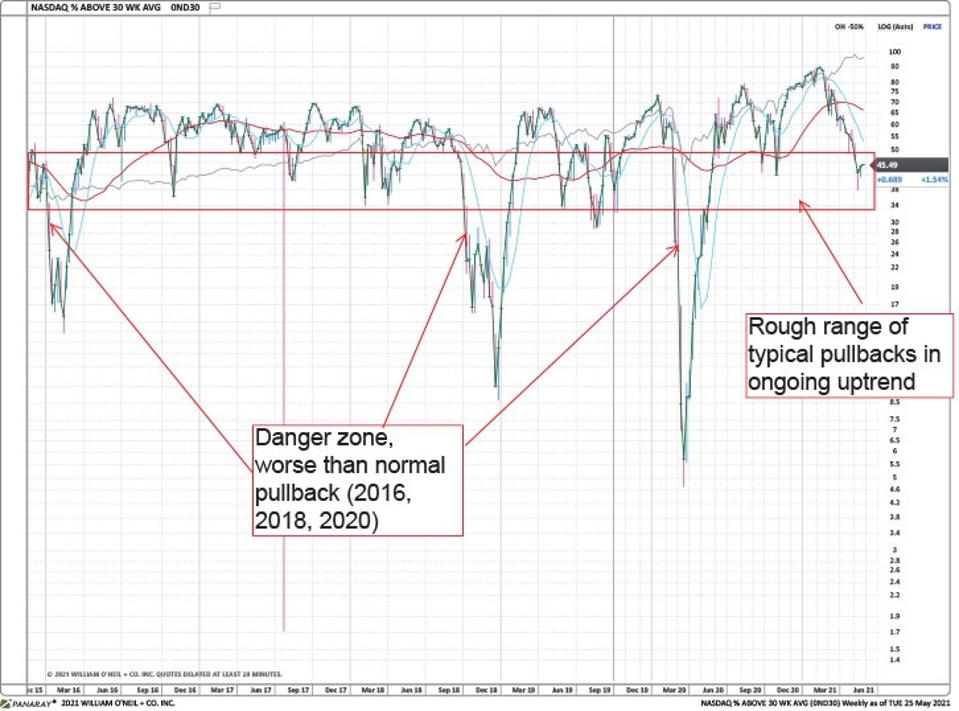
I continue to watch overall market breadth relative to the 150-DMA as a possible signal to become more cautious. While the constituents of the NYSE remain healthy with more than 70% of stocks trading above the 150-DMA, on the NASDAQ
William O'Neil + Co.
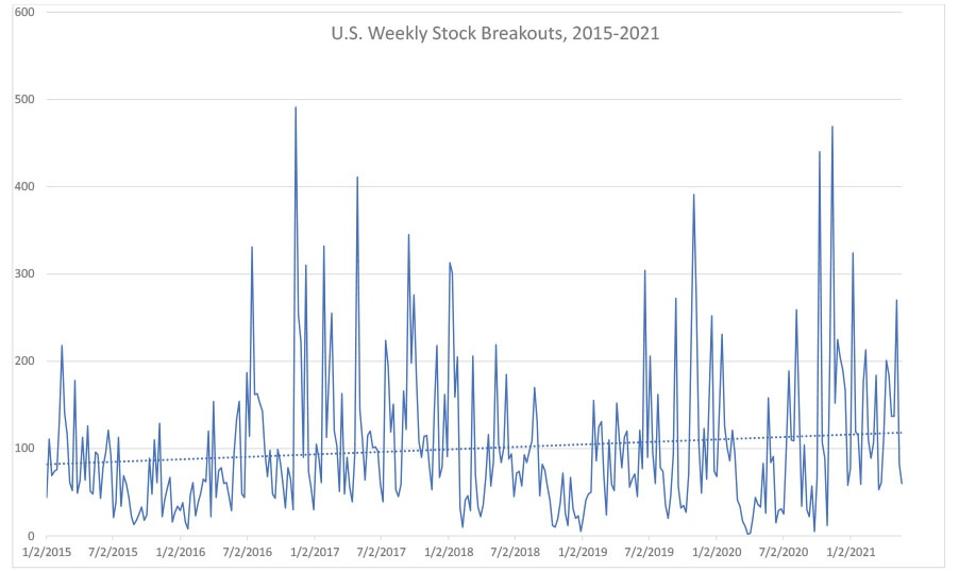
I’m also monitoring O’Neil’s proprietary measure of the number of individual stocks breaking out of confirmed price bases or consolidations. When the number of breakouts is increasing, the market is usually becoming more bullish and gaining in price. When the number of breakouts falls rapidly, the market often corrects. The recent decline suggests a stalling market (see table below), but this sideways action is often positive, as stocks consolidate before further gains. However, if the number of breakouts remains low or declines significantly from here, that would be a very bearish sign.
William O'Neil + Co.
What are your favorite market indicators? Tweet me at @Randy_Watts_ and let me know what you’re watching!
Kenley Scott, Director, Global Sector Strategist at William O'Neil + Company, an affiliate of O’Neil Global Advisors, made significant contributions to the data compilation, analysis, and writing for this article.
DISCLOSURE:
No part of my compensation was, is, or will be directly or indirectly related to the specific recommendations or views expressed herein. O’Neil Global Advisors, its affiliates, and/or their respective officers, directors, or employees may have interests, or long or short positions, and may at any time make purchases or sales as a principal or agent of the securities referred to herein.